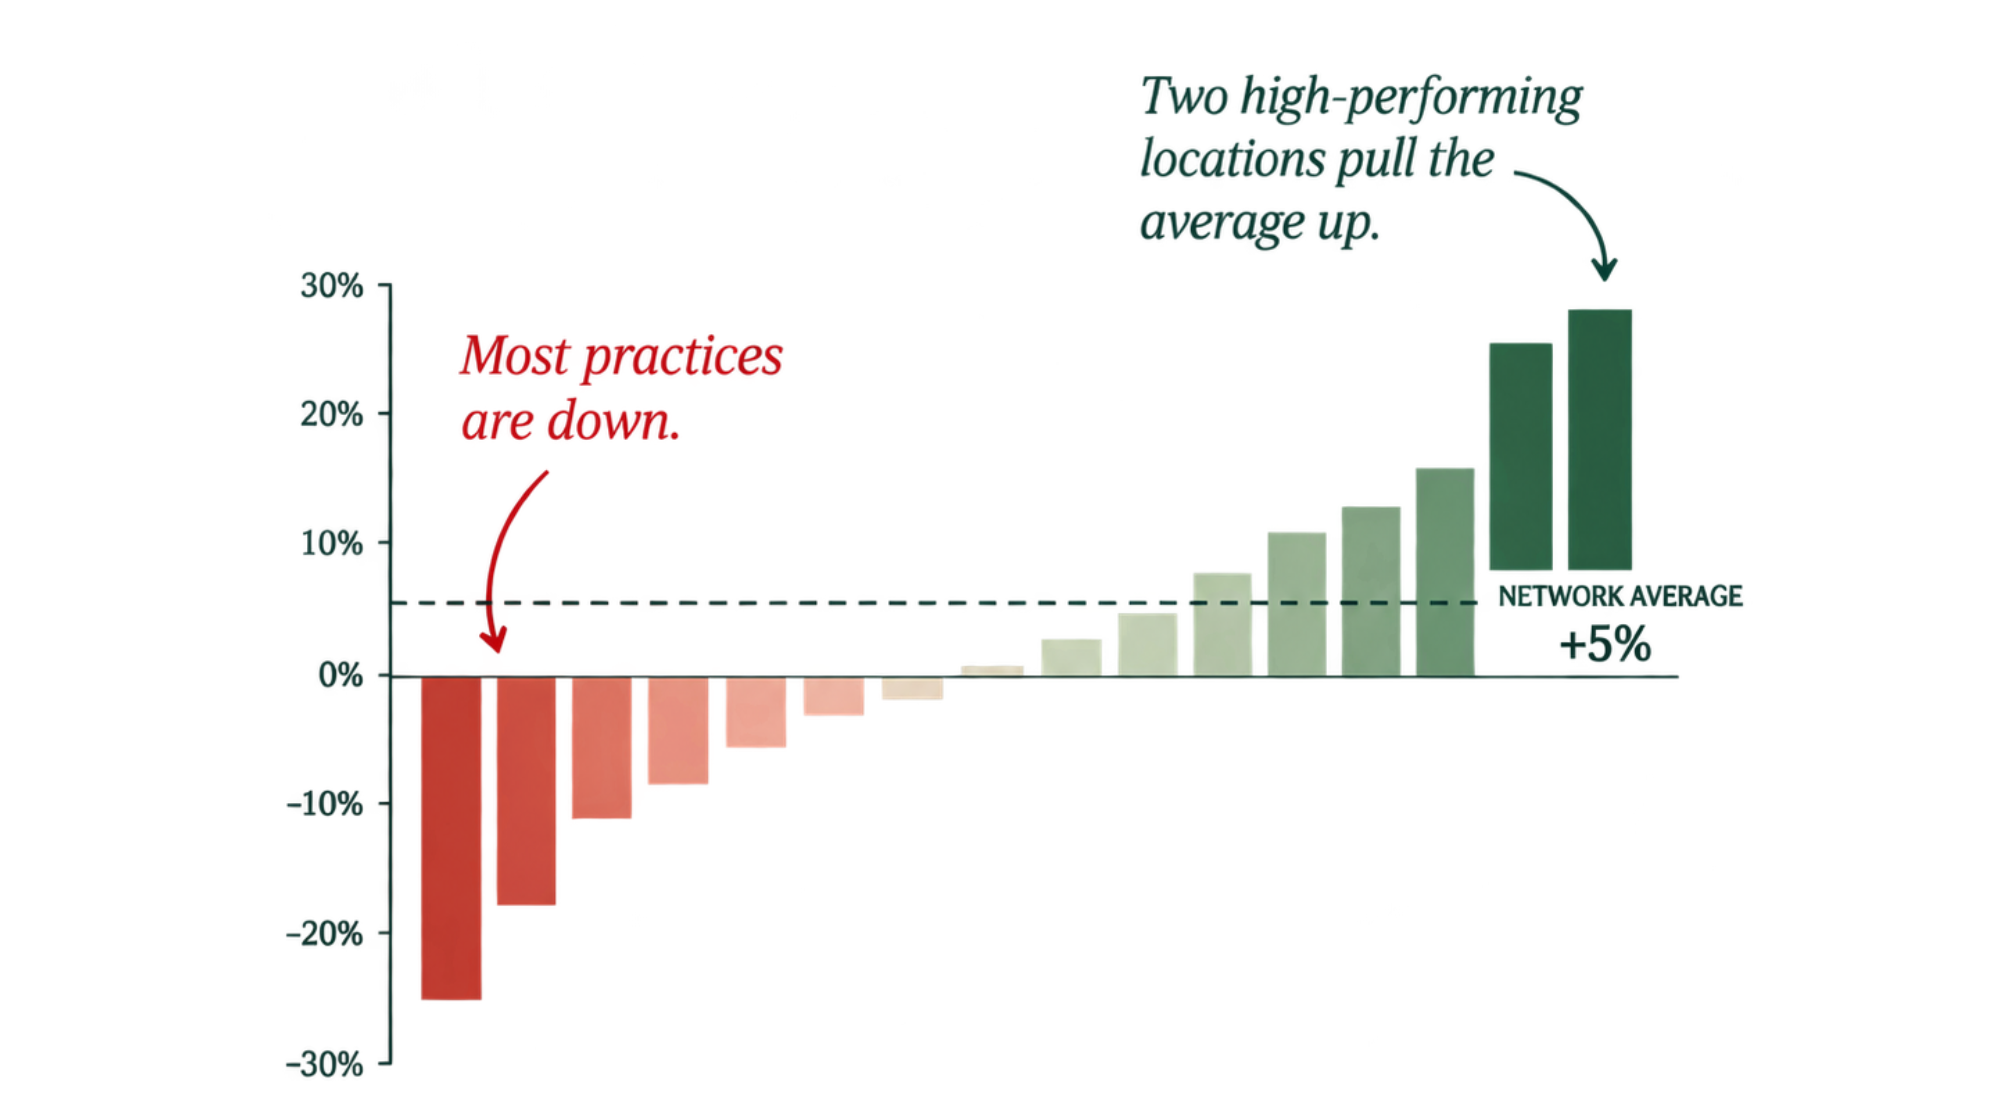
A consolidated growth target can hide a weakening network.
For many DSOs, the headline number tells a reassuring story. New-patient volume is up. Growth targets are on track. The network is performing. But averages can conceal as much as they reveal—often more.
A consolidated metric smooths out reality. Two or three exceptional practices can pull the entire organization’s average upward, masking the underperformance across dozens of locations. The result is a network that looks healthy on paper but is actually losing ground.
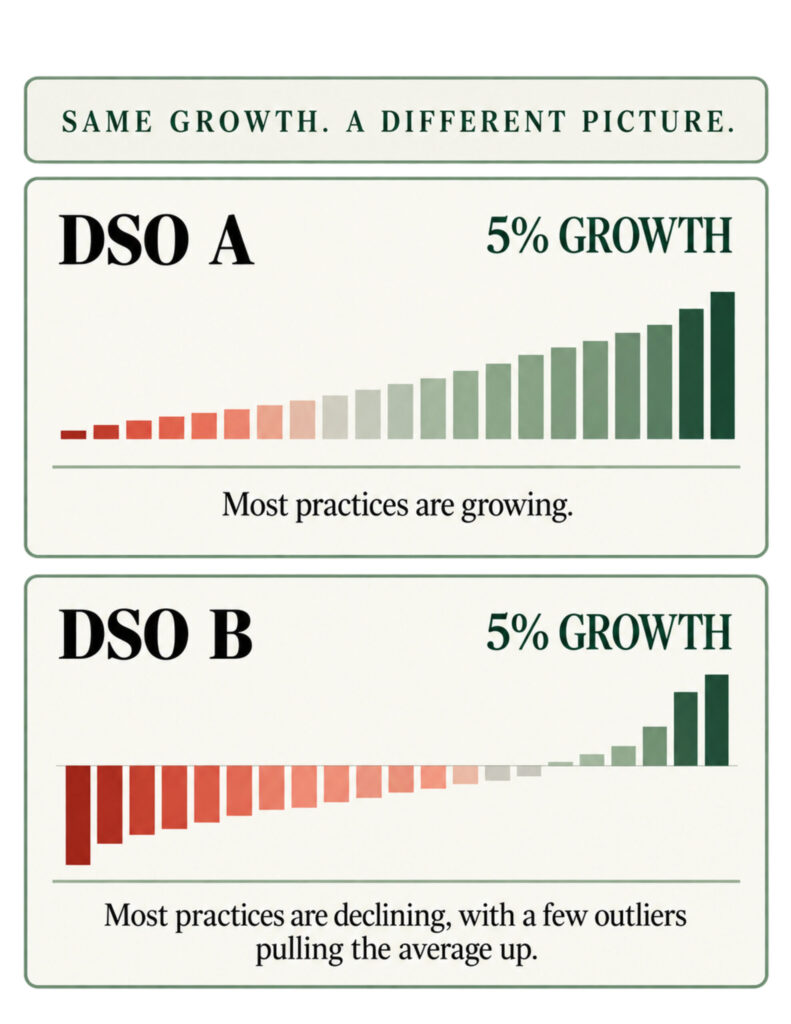
Consider two hypothetical DSOs. Both report 5% average practice growth in 2026. In DSO A, the growth is broad-based, with most practices contributing. In DSO B, the same average is achieved by a small number of high-performing outliers while the majority of practices decline. Same number. A very different reality.
If you’re only looking at the average, you can’t see where your growth is coming from—or what’s at risk. Are your strongest practices revealing a scalable model? Are underperforming locations facing common challenges? Or are you simply benefiting from a few outliers?

The Risk of a Misleading Average
As the example illustrates, an average doesn’t tell you how your organization, middle-of-the-road practice, or struggling location is performing. It doesn’t show you what’s driving the results. And it can’t tell you whether your growth is sustainable.
DSOs aren’t monoliths; they are collections of practices with different conditions. Each needs targeted action to address its constraints and opportunities. To make better decisions, you need to look beyond the average, into the distribution, the stability of each practice, and the real drivers behind performance.
The consequence of managing to an average is not simply imprecise reporting. High-performing practices may be treated as scalable models before their success is understood. Weak practices may receive broad initiatives that never address their actual constraints. Emerging risks remain hidden because stronger locations continue to carry the consolidated result.
The average is useful. It is not sufficient.
Median, Distribution, and Volatility in Plain Language
Leaders need several views of performance because each answers a different question. Use your organization’s performance median, distribution, and volatility to create a more well-rounded view and an actionable framework.
Use the median for a true middle-of-the-road practice, ignoring outliers. Your organizational median is a real practice and identifying that median practice is the first step toward addressing your organizational health.
To see how your practices cluster or spread across growth rates, create a performance distribution graph. Ten percent average growth can reflect a tight cluster or a wide split between rapid growers and declining practices. Distribution adds the context necessary to better understand your reality.
Volatility describes how sharply a practice’s results fluctuate over time. The Planet DDS 2026 Deep Dive Report found that “the most volatile 10% of practices are shrinking by 3.4% while the most consistent practices are growing by 6.1%.” The association does not prove cause, but it identifies practices that warrant investigation. A high-performing location with unstable results may be more fragile than its current production suggests.
Together, average, median, distribution and volatility reveal the shape of performance. They still do not explain what is driving it or what leadership should do next.
For that, you need a framework that moves you past generalized statistics to collecting actionable information about your practices. Consider these four views of practice performance:
- Level: How does the practice compare with the right peer cohort? This establishes whether performance is relatively strong or weak.
- Direction: Is performance improving, declining, or stalled over a meaningful period? Look for a sustained trend rather than a single favorable month.
- Reliability: Is performance stable over time or volatile? Test whether the result depends on conditions that can be sustained.
- Drivers: What is producing the result, and is it sustainable? Identify the forces behind growth or decline and the constraints those forces may be creating.
Direction is easy to observe. It is harder to interpret. A rising trend is not permission to replicate a practice across the network. Leaders must first determine whether the gains are reliable, what produced them and whether other practices share the conditions required to repeat them.
Strong Metrics Can Conceal Problems
No operating metric should be interpreted alone.
High new-patient volume is an important predictor of practice growth, but it does not prove operational health or reliability. Case acceptance can increase revenue potential, but only when accepted treatment is scheduled and completed. Strong production can coexist with deteriorating margins, rising turnover or an unstable schedule.
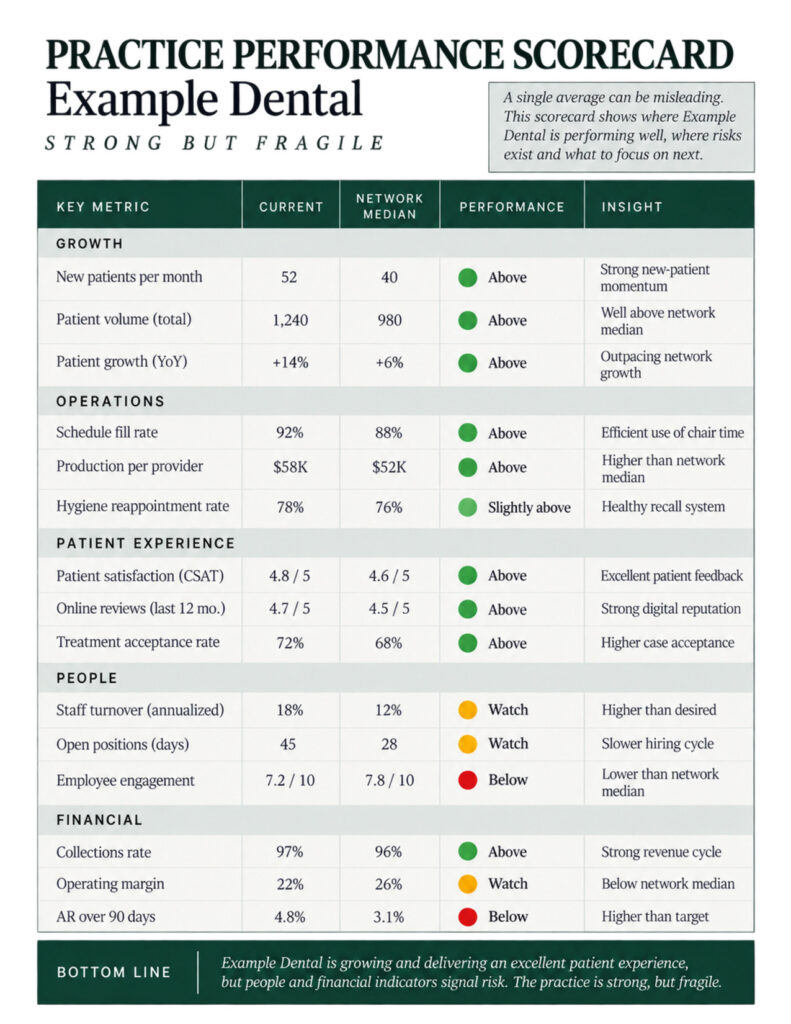
Example Dental, a hypothetical high-performing location in DSO B, illustrates the risk. Its new-patient volume, case acceptance and same store production are strong. Yet treatment completion trails accepted cases, scheduling is inconsistent and turnover is rising. The headline metrics signal strength. The operating system signals fragility.
The natural response may be to treat low completion as a communication or workflow problem. That may be correct—but it is still a hypothesis. As Curve Dental notes, “One of the most common diagnostic errors in dental practice management is looking for the root cause of a problem in the same category where the symptom appears.”


The scorecard must therefore be read as a system. Strong demand alongside weak completion could reflect scheduling discipline, provider capacity, case mix, staffing disruption or patient follow-up. Elevated turnover may be causing instability, resulting from it or both. Example Dental’s scorecard establishes that the practice is strong but fragile. It does not, by itself, identify the cause.
Before prescribing a capacity solution, DSO B should validate the completion data, audit accepted-but-unscheduled treatment, compare demand with provider availability and review confirmation and scheduling workflows. Diagnosis must precede intervention.
Segment Practices into Meaningful Cohorts
A practice can outperform the network and still underperform its true peers. That is why the level view depends on the right comparison group.
Useful cohorts reflect operating reality. They may combine specialty, practice maturity, acquisition vintage, geography, payer mix, provider model and practice size. The purpose is not to create more reporting categories. It is to compare locations facing similar conditions so leaders can distinguish systemic patterns from local exceptions.
Cohorts should not be changed simply because an intervention fails. Reassign a practice only when its defining operating characteristics change or when the original classification was wrong. Otherwise, leaders risk reorganizing the data until it produces the pattern they expected to see.
Example Dental sits within a general-dentistry cohort. It performs above its peers, but it is also among the cohort’s most volatile locations. Comparing its workflows, staffing and completion patterns with more stable peers can help DSO B test possible causes without assuming that the highest-producing practice has the best operating model.
High-performing outliers should be treated as hypotheses— not automatically as best practices.
Match the Intervention to the Practice Condition
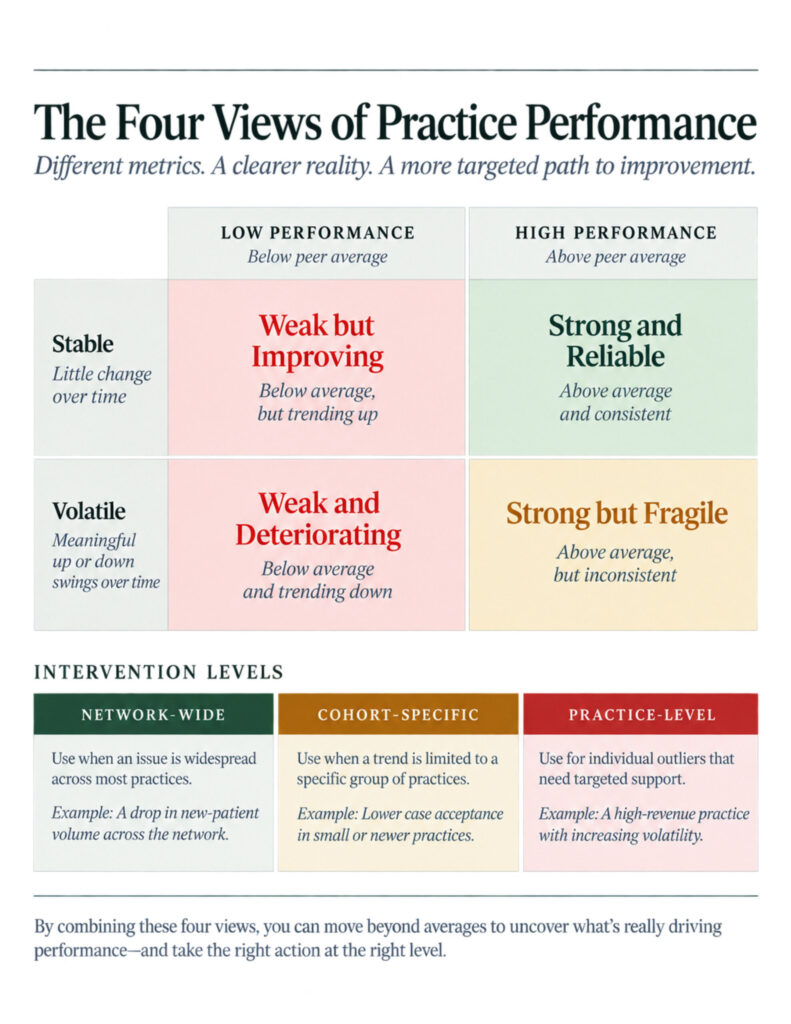
Once leadership understands level, direction, reliability and drivers, each practice can be classified into one of four operating conditions:
- Strong and reliable: Performance is strong, stable and supported by sustainable drivers. Protect it, document it and determine what can be replicated.
- Strong but fragile: Performance is strong but volatile or dependent on concentrated drivers. Stabilize the operating model before scaling it.
- Weak but improving: Current performance is weak, but direction is consistently positive. Preserve momentum and monitor the intervention.
- Weak and deteriorating: Performance is weak and moving lower. Diagnose the constraint and begin a focused turnaround.
Classification is only the first decision. Leaders must also choose the correct level of response.
A recurring root cause across the portfolio may require a network-wide solution. A pattern concentrated among similar practices may call for a cohort-specific intervention.
An isolated issue belongs at the practice level. The scale of the response should follow the scale of the cause—not the visibility of the symptom.
Example Dental is strong but fragile. Its immediate need is practice-level stabilization, not network-wide replication. A focused 60-day plan should begin by validating completion data and auditing unscheduled treatment. Leadership can then repair confirmation workflows, assess workload and determine whether capacity is contributing to the gap.
Only after the cause is verified should DSO B decide whether the lesson is local, shared by the cohort or systemic across the network.
The intervention should have a clear owner, a defined outcome, supporting process measures and at least one balancing measure—such as patient experience, clinical quality or team turnover. Improvement in one metric should not be purchased by weakening another part of the practice.
What Are Your Averages Concealing?
At your next performance review, do not stop at the consolidated growth rate.
Ask how many practices improved, how many declined, how widely results varied and how concentrated the growth was. Compare each practice with the right peers. Test whether performance is durable. Identify the drivers behind both strength and weakness. Then assign the intervention at the network, cohort or practice level according to the pattern. The executive question is simple:
Are your strongest practices revealing a scalable operating model—or concealing the weakness of the rest of the network? High-performing networks are not built by managing a number on a dashboard. They are built by understanding what that number is hiding—and acting before the average finally reveals the problem.
REFERENCES
1. “2026 Dental Industry Outlook: Deep Dive,” 2026 Dental Industry Outlook: Deep Dive, June 1, 2026, https://www.planetdds.com/ resources/2026-deep-dive-report/.
2. “Dental Metrics Explained: What Each One Measures, What It Misses, and When to Review It,” Curve Dental, July 29, 2026, https://www.curvedental.com/dental-blog/dental-metricsexplained-what-each-one-measures-what-it-misses-and-whento-review-it.